Showing posts with label Map. Show all posts

Wednesday, February 18, 2009

how romantech

An example of personal technology?

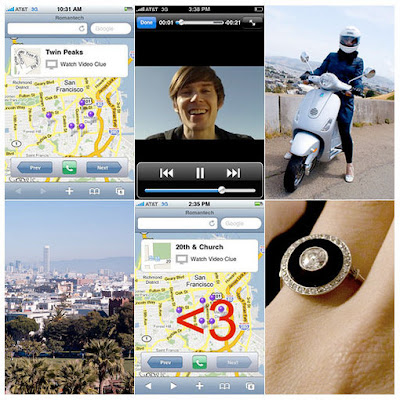
User interface designer Bryan Haggerty, programmer at LinkeIn, proposed to his girlfriend Jeannie Choe, former writer at Core77, with an iPhone application which he deigned himself.

It was last week that he popped the big question, but only after having his girlfriend guided through a route in San Francisco by the iPhone app. 

The app, which Haggerty calls "Romantech", displays a map containing location points throughout San Francisco. Each of the points in the map were tagged with a short video clip of Haggerty giving little clues of where Choe should travel to next. 


After a while, both met in a Park where all the points on the map connected to form the shape of a <3>

(The <3 is a heart symbol for those of you who don't know the lingo)>


Wednesday, December 24, 2008

visualizing friend networks

Sebastian Van Sande has developed Visualizer, a tool that allows you to explore your Facebook social network graphically. This is the "Visualization" of my Facebook account.

It's great as I can see friends connected to other friends and also the ones who are only connected to me. The tool allows for filtering your network by gender and relationship status.

However I'm confused as to the length of the connecting lines. What do different line lengths represent? Some of my close friends appear close to me on the map, and others far away. Does the program determine who is close and who is further away through a friends activity?

It would be even more useful if short lines represented close friends and vic-versa. This way, we would be able to visualize not only our map of friends, but also the various levels of relationships between each other. 

Imagine if we were able to connect our maps with each others! If everyone on Facebook did this then I would inevitably be connected to, say, Barrack Obama (presumably through 6 corresponding people considering the "6 degrees of separation" theory to be accurate).

Wouldn't it be great to see a whole world networked graphically using a social networking site?

As a visualization tool, Van Sande has created an interactive application that communicates a complex network greatly. As with the underground maps, credit is given to those who achieve simplistic communication of labyrinth-like infrastructures.

However in comparison to Nexus by Ivan Kozik (Below), Visualizer is lacking as both an interactive and informative tool for the search for information within a complex infrastructure. 

Nexus is another friend grapher for Facebook. It calculates friend similarity by parsing profiles, and highlights links between friends who share interests and groups. The visualization resembles a costilation and looks far more striking than Visualizer. 

And the method of retrieving information is far more straight forward. Another great example of a "walk up and use system."

Monday, December 22, 2008

New York Subway (a comparison)

Further to my obsession of the London Underground, I thought it would make sense to have a look at how other underground networks from around the word have been visualized.

In 1972, Italian designer Massimo Vignelli re-designed George Solomon's New York Subway map; and I think it is a fantastic piece of work. 


All the lines are represented by different colours, and each station represented by a black dot. In contrast to the original map design, the visual problem of awkward angles of the lines was solved by making each line 45 0r 90 degrees. Although this simplifies the map immensely, an obvious number of geographical liberties had to be taken. For example the map shows Central Park as a square rather than a rectangle.

However I do not see this as a problem. The aim of any map is to provide information in a way that is simple to understand/read. Re-proportioning certain geographical aspects of the map would certainly be detrimental to this objective. 

Do you spot a resemblance in this map? 

Obviously Vignelli was inspired by Harry Beck's design of the London Underground map (1933). Beck was the one who made all lines 45 and 90 degrees; and more importantly made the map a representation of the underground infrastructure, not influenced by the geographical layout of London itself. 

This makes me think about how visualization works. Do aspects of a design/map/flow chart etc need to be neglected in order to achieve ultimate simplicity?

Friday, December 19, 2008

communicating complex (or simple) information


We have an overwhelming amount of information all around us. We can see it and we can understand it, however one of the greatest challenges for a designer is to make sense of this information.

Don't take the word "information" too literally. Bear in mind that everything around us contains an element of information for us to interpret. For example, a ball has affordance in that it sends a visual clue as to how it should be used. We know to bounce, throw or kick a ball; and we know not to eat it!

Some information is often difficult to communicate to others. This hypothesis is something I have began to expand on in my area of research for my Master of Design degree. How can designers be good "Visualization Artists?"

It has proved useful to me in the past to be able to articulate my ideas/thoughts/research to others through giving examples. For this example, I'd like to write about one of most fascinating visualizations of complex information from one of my favourite cities, London. 

The London Underground has 11 lines and 268 stations. Approximately 4.25 million people use the underground everyday. 

The sheer complexity of the infrastructure of lines and stations was simplified beautifully by Harry Beck, an engineering draughtsman, in 1933. The London Underground map a perfect example of great "visualization" as it demonstrates how complicated information (the line and station infrastructure) can be communicated in a graphic language (a map) that is both easy to understand and remember. 


Over the festive season I plan on taking a little break from my studies, but I will be keeping my mind active by reading a few books on the topic of visualization:

Kress, G (2006) Reading Images: The Grammar of Visual Language. Routledge, London.
McCloud, S (1993) Understanding Comics: The Invisible Art. Kitchen Sink Press, New York, NY.
Carroll, J (2002) Usability Engineering. Scenario-Based Development of Human-Computer Interaction. Kaufmann Publishers, San Francisco, CA.
Kim, S (2004) VizAbility: Learn to Communicate Visually. Course Technology, Boston, MA.