skip to main
|
skip to sidebar
ideas, thoughts & trends
Monday, March 2, 2009
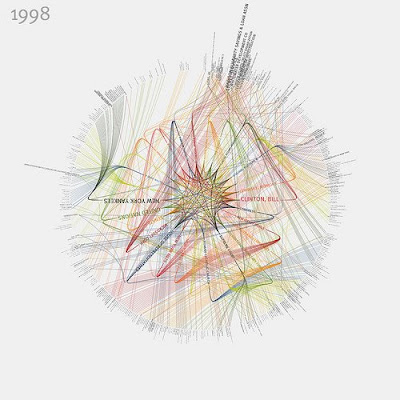
NY Times Visualizations
Visualizations that represent the people and organizations most mentioned in New York Times articles from 1984-2009 have been created by Jer Thorp. The visualizations show connections between the people and therefore relationships between them all.
No comments:
Post a Comment
Newer Post
Older Post
Home
Subscribe to:
Post Comments (Atom)
Labels
Andreas Koller
(1)
animation
(4)
Apple
(1)
bar charts
(1)
Berlin
(1)
Burak Arikan
(1)
Carlos Lascano
(1)
communication
(15)
complex information
(8)
daily routines
(1)
Deutsche Telekom Laboratories
(1)
Dubner
(1)
economy
(1)
ethnography
(4)
fable
(2)
Facebook
(4)
film
(3)
Flash
(2)
Freakonomics
(1)
G2
(2)
Harry Beck
(1)
heirlooms
(2)
IC product
(2)
identity
(1)
IDEO
(2)
infrared
(1)
interaction
(6)
iPhone
(1)
Ivan Kozik
(1)
Jer Thorp
(1)
livescribe
(1)
Livett
(1)
London
(1)
Map
(4)
Massimo Vignelli
(1)
metaphors
(1)
Mind Map
(1)
New Designers
(2)
New York
(1)
New York Times
(1)
object tracking
(2)
obsolescence
(2)
paho mann
(1)
personality
(2)
Philipp Steinweber
(1)
postcard
(2)
processing
(4)
prototyping
(5)
Reflection
(12)
religion
(1)
retroreflection
(1)
Richard Banks
(4)
Richard Harper
(1)
Sebastian Van Sande
(1)
similar diversity
(1)
Still Frame
(1)
stop motion
(2)
story telling
(6)
storyboards
(9)
T3
(3)
technology
(9)
Terrorism
(1)
text analysis
(2)
Thoughtless Acts
(1)
Tim Brown
(1)
tokyo
(1)
Twitter
(2)
ubiquitous computing
(1)
Underground
(3)
Video
(1)
vimeo
(2)
Visualization
(21)
VVVV
(1)
Walk up and use
(1)
webcam
(1)
No comments:
Post a Comment